 |

Submitted by , posted on 03 October 2001
|
 |

Image Description, by

I am a 18 year old student from Germany. In the 12th level we have to do
a scientific work - the so called Facharbeit. My task was to code an
application which simplifies the measurement and displaying of electric
potentials in an electrolytical trough.
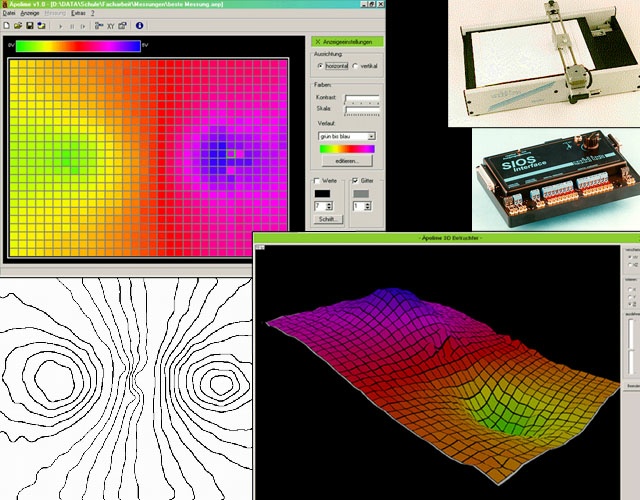
On the upper left picture you can the see the main application (coded
with Delphi/DelphiX) which controls the hardware over the serial
interface (upper right pictures). The program grabs a raster-scan of the
electrical potential distribution and displays it in a two-dimensional
way on the screen. Morevover the application allows the user to restore
the errors of measurement and to display the measurement result in
different ways (colors, frames, text...).
On the lower right image you can see a three dimensional projection of
the measurement results. It is displayed by an external viewer which i
coded quick and dirty with Delphi and WdirectX.
Finally, in the upper left corner, you can see a measurement which i
edited with Photoshop. It should show the electrical potential
distribution in a classical way with the so called potential-lines.
You can get more informatoin about my scientific work on
www.zuidinga.de/facharbeit/einleitung.htm (only in German!)
I would be pleased if i get feedback ;-)
|
|

